BITING THE BIG APPLE 🍎

An investigation into NYC's food desert swamp insecurity problem


Jonathan Marcos - Colloquium III


KEY: 🔴: Neighborhoods making lower than 33,714 USD, 🔺: Population. Taller spikes correlates to greater population

82 neighborhoods, encompassing 225000+ people, make average incomes less than 33,714. This exceeds
the populations of cities such as Richmond and Yonkers.

ABSTRACT:

The USDA recommends that individuals spend at
least 280.95 a month on average to afford
economic, healthy meals. Per USDA statistics,
10% of a household’s salary should be
invested in order to purchase these meals
comfortably, estimating that an income of
33,714 USD is necessary.

In the context of New York City's 196 neighborhoods,
82 of them make an average median income less
than this threshold. In these neighborhoods,
more than 225,000 people are dependent on some
kind of food assistance program in order to
comfortably afford meals. Though this encompasses
only 2.5% of people in the city, the number is
still fairly large– greater than the populations
of cities such as Yonkers and Richmond. Food
insecurity makes individuals more prone to
malnutrition, resulting in increased risks of
high blood pressure, diabetes and other diet-related
health problems.

Admittedly, this only scratches the surface–
there are far more variables that encompass
what makes a neighborhood food insecure.
Biting the Big Apple will go through a
comprehensive deep dive of New York City’s food
insecurity, elaborating what food insecurity is
in the context of NYC, where food insecurity is
most prevalent, why it is important to address
food insecurity, what does food insecurity look
like, and how food insecurity can be tackled
throughout the city.


01: WHAT IS FOOD INSECURITY

Food insecurity is the inability to comfortably
access affordable, healthy dietary options.
In the context of New York City, it takes two forms:

  • Food Desert: Areas that have both poor
    proximity to healthy food options and also
    cannot afford it

  • Food Swamp: Areas that have good
    physical proximity to healthy food options,
    but populace has difficulty affording it

  • On the contrary, there's also:

  • Food Oasis: Areas that have good physical
    proximity to healthy food options and where populace
    can afford it

  • In incumbent investigations by the USDA, food insecurity
    is mostly emphasized by the lack of physical proximity
    (10 mile radius) to a supermarket. However, since NYC
    is so dense, the term "food swamp" must be used to discuss the
    lack of economical access to healthier options. In order
    to truly discuss which neighborhoods are riddled with
    food insecurity, various investigations and correlations
    of data such as income, supermarket and bodega counts,
    median rent and vehicle counts are all correlated to
    paint NYC's food insecurity landscape.

    Your Image

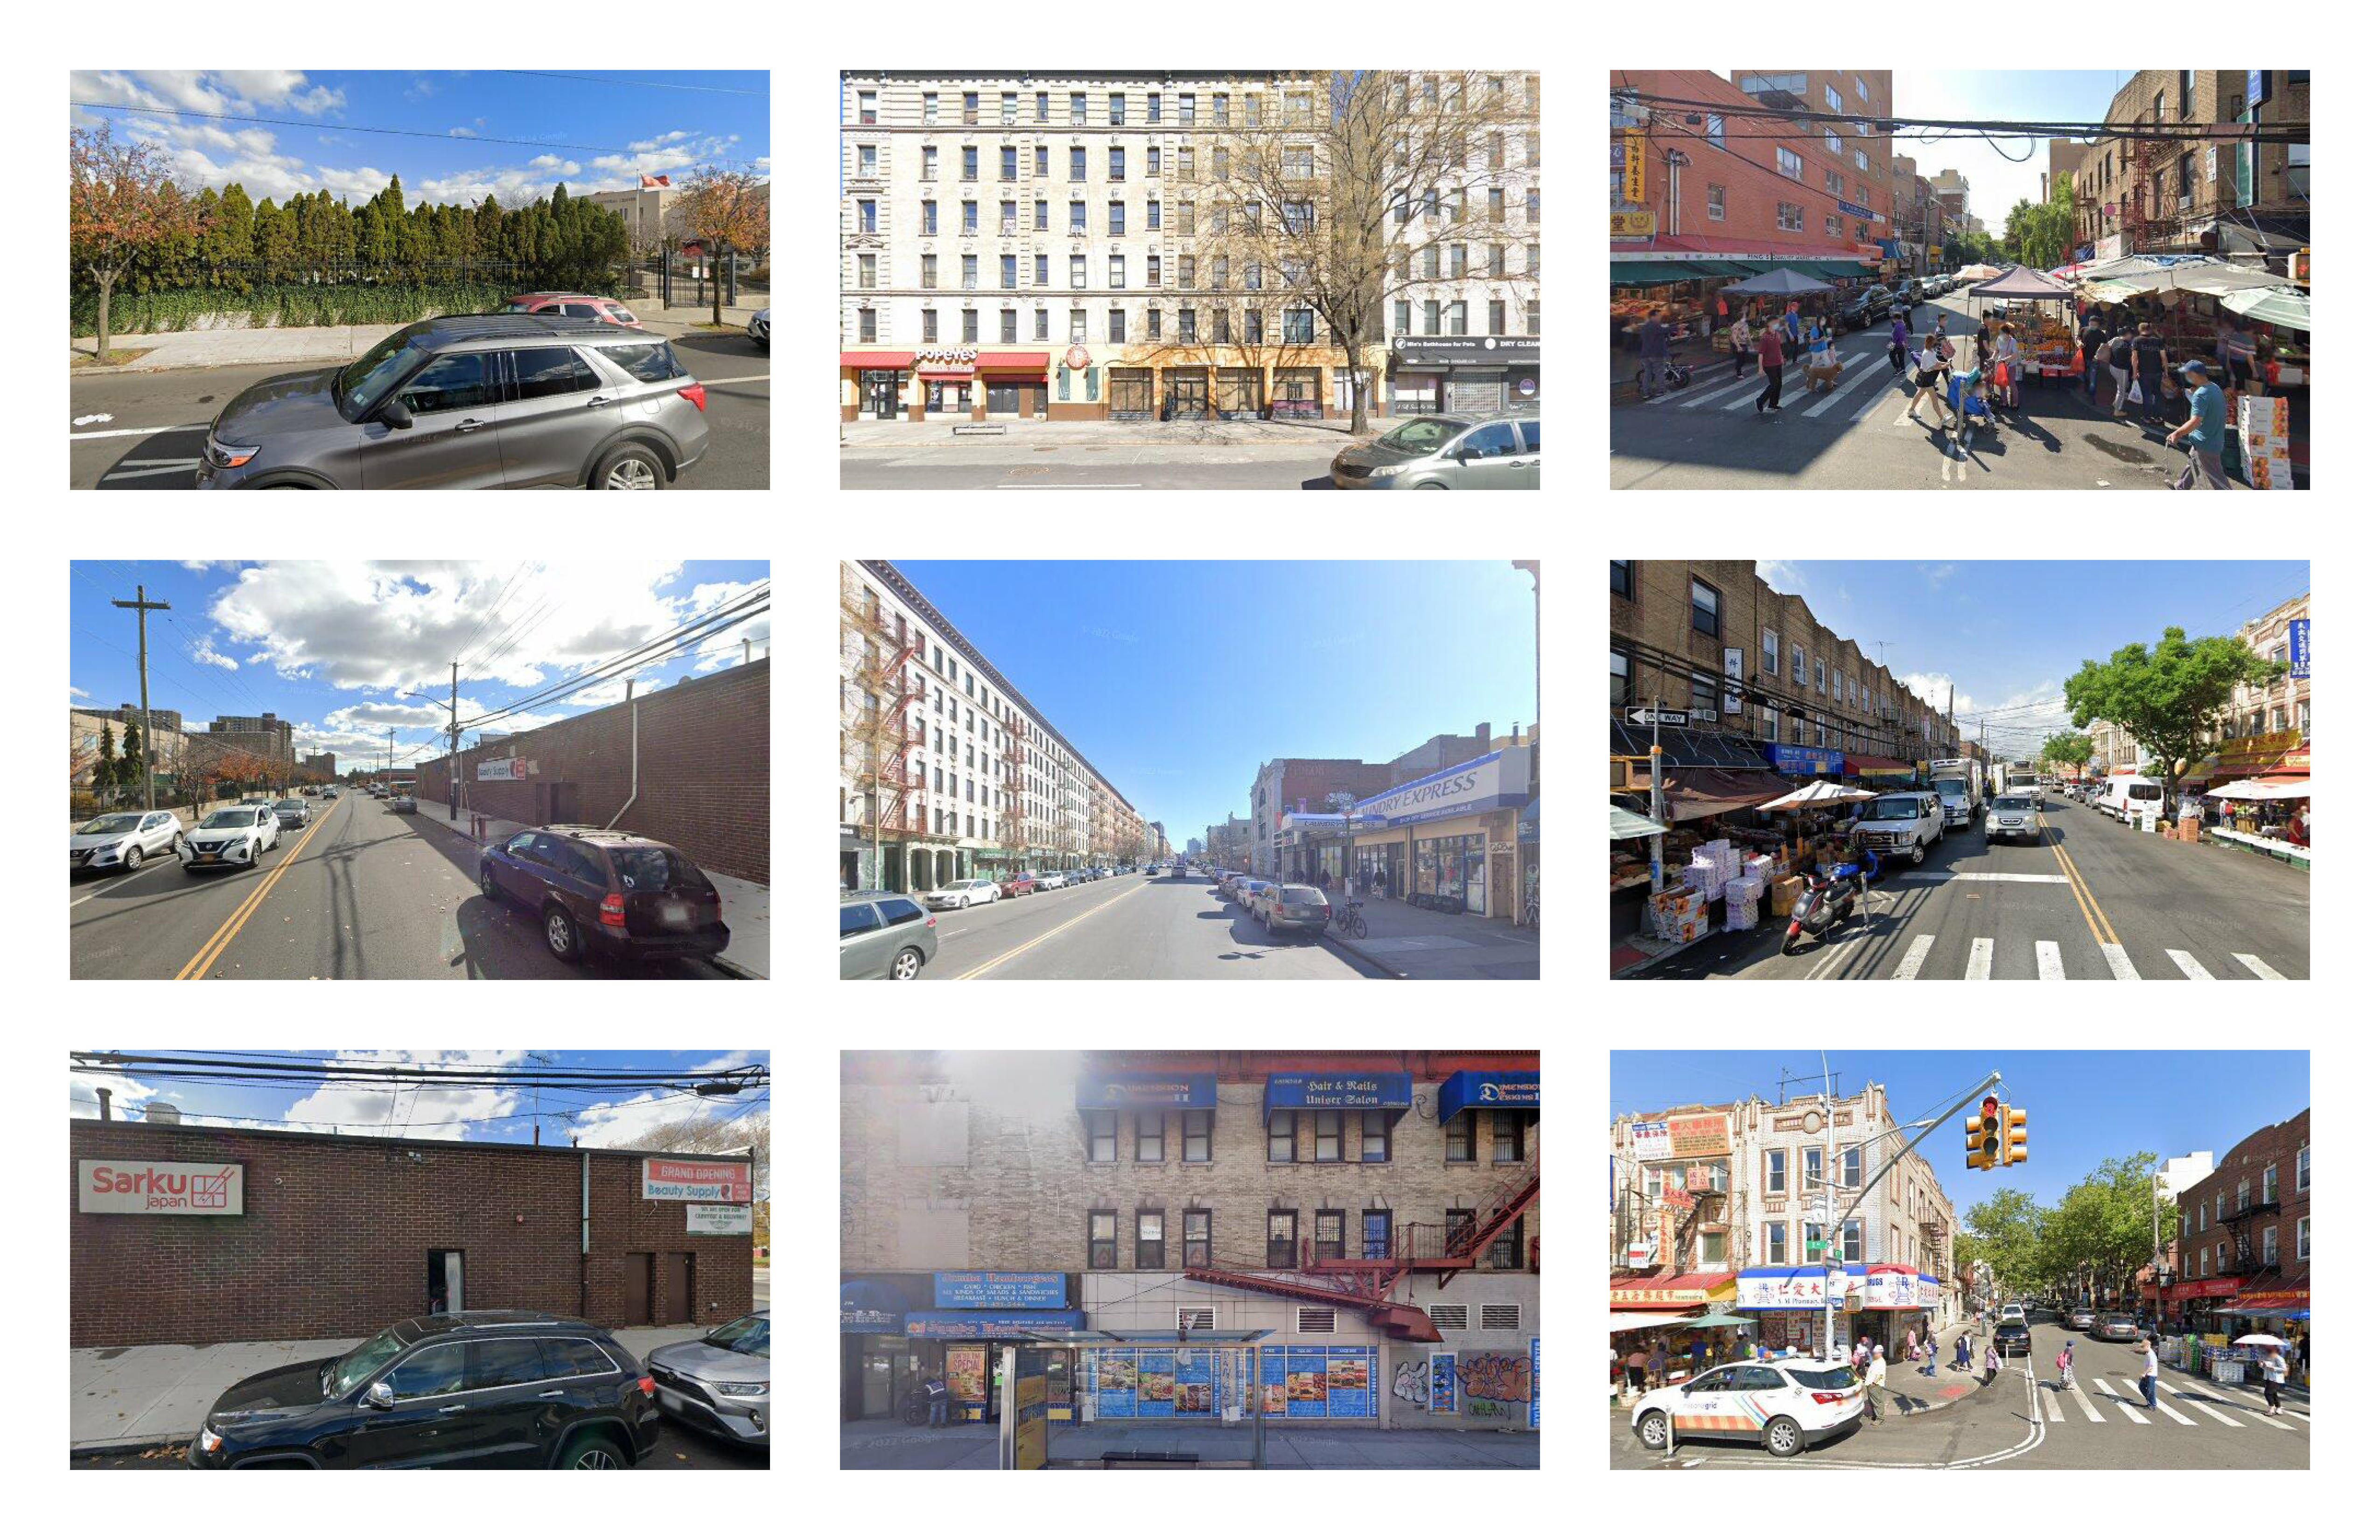
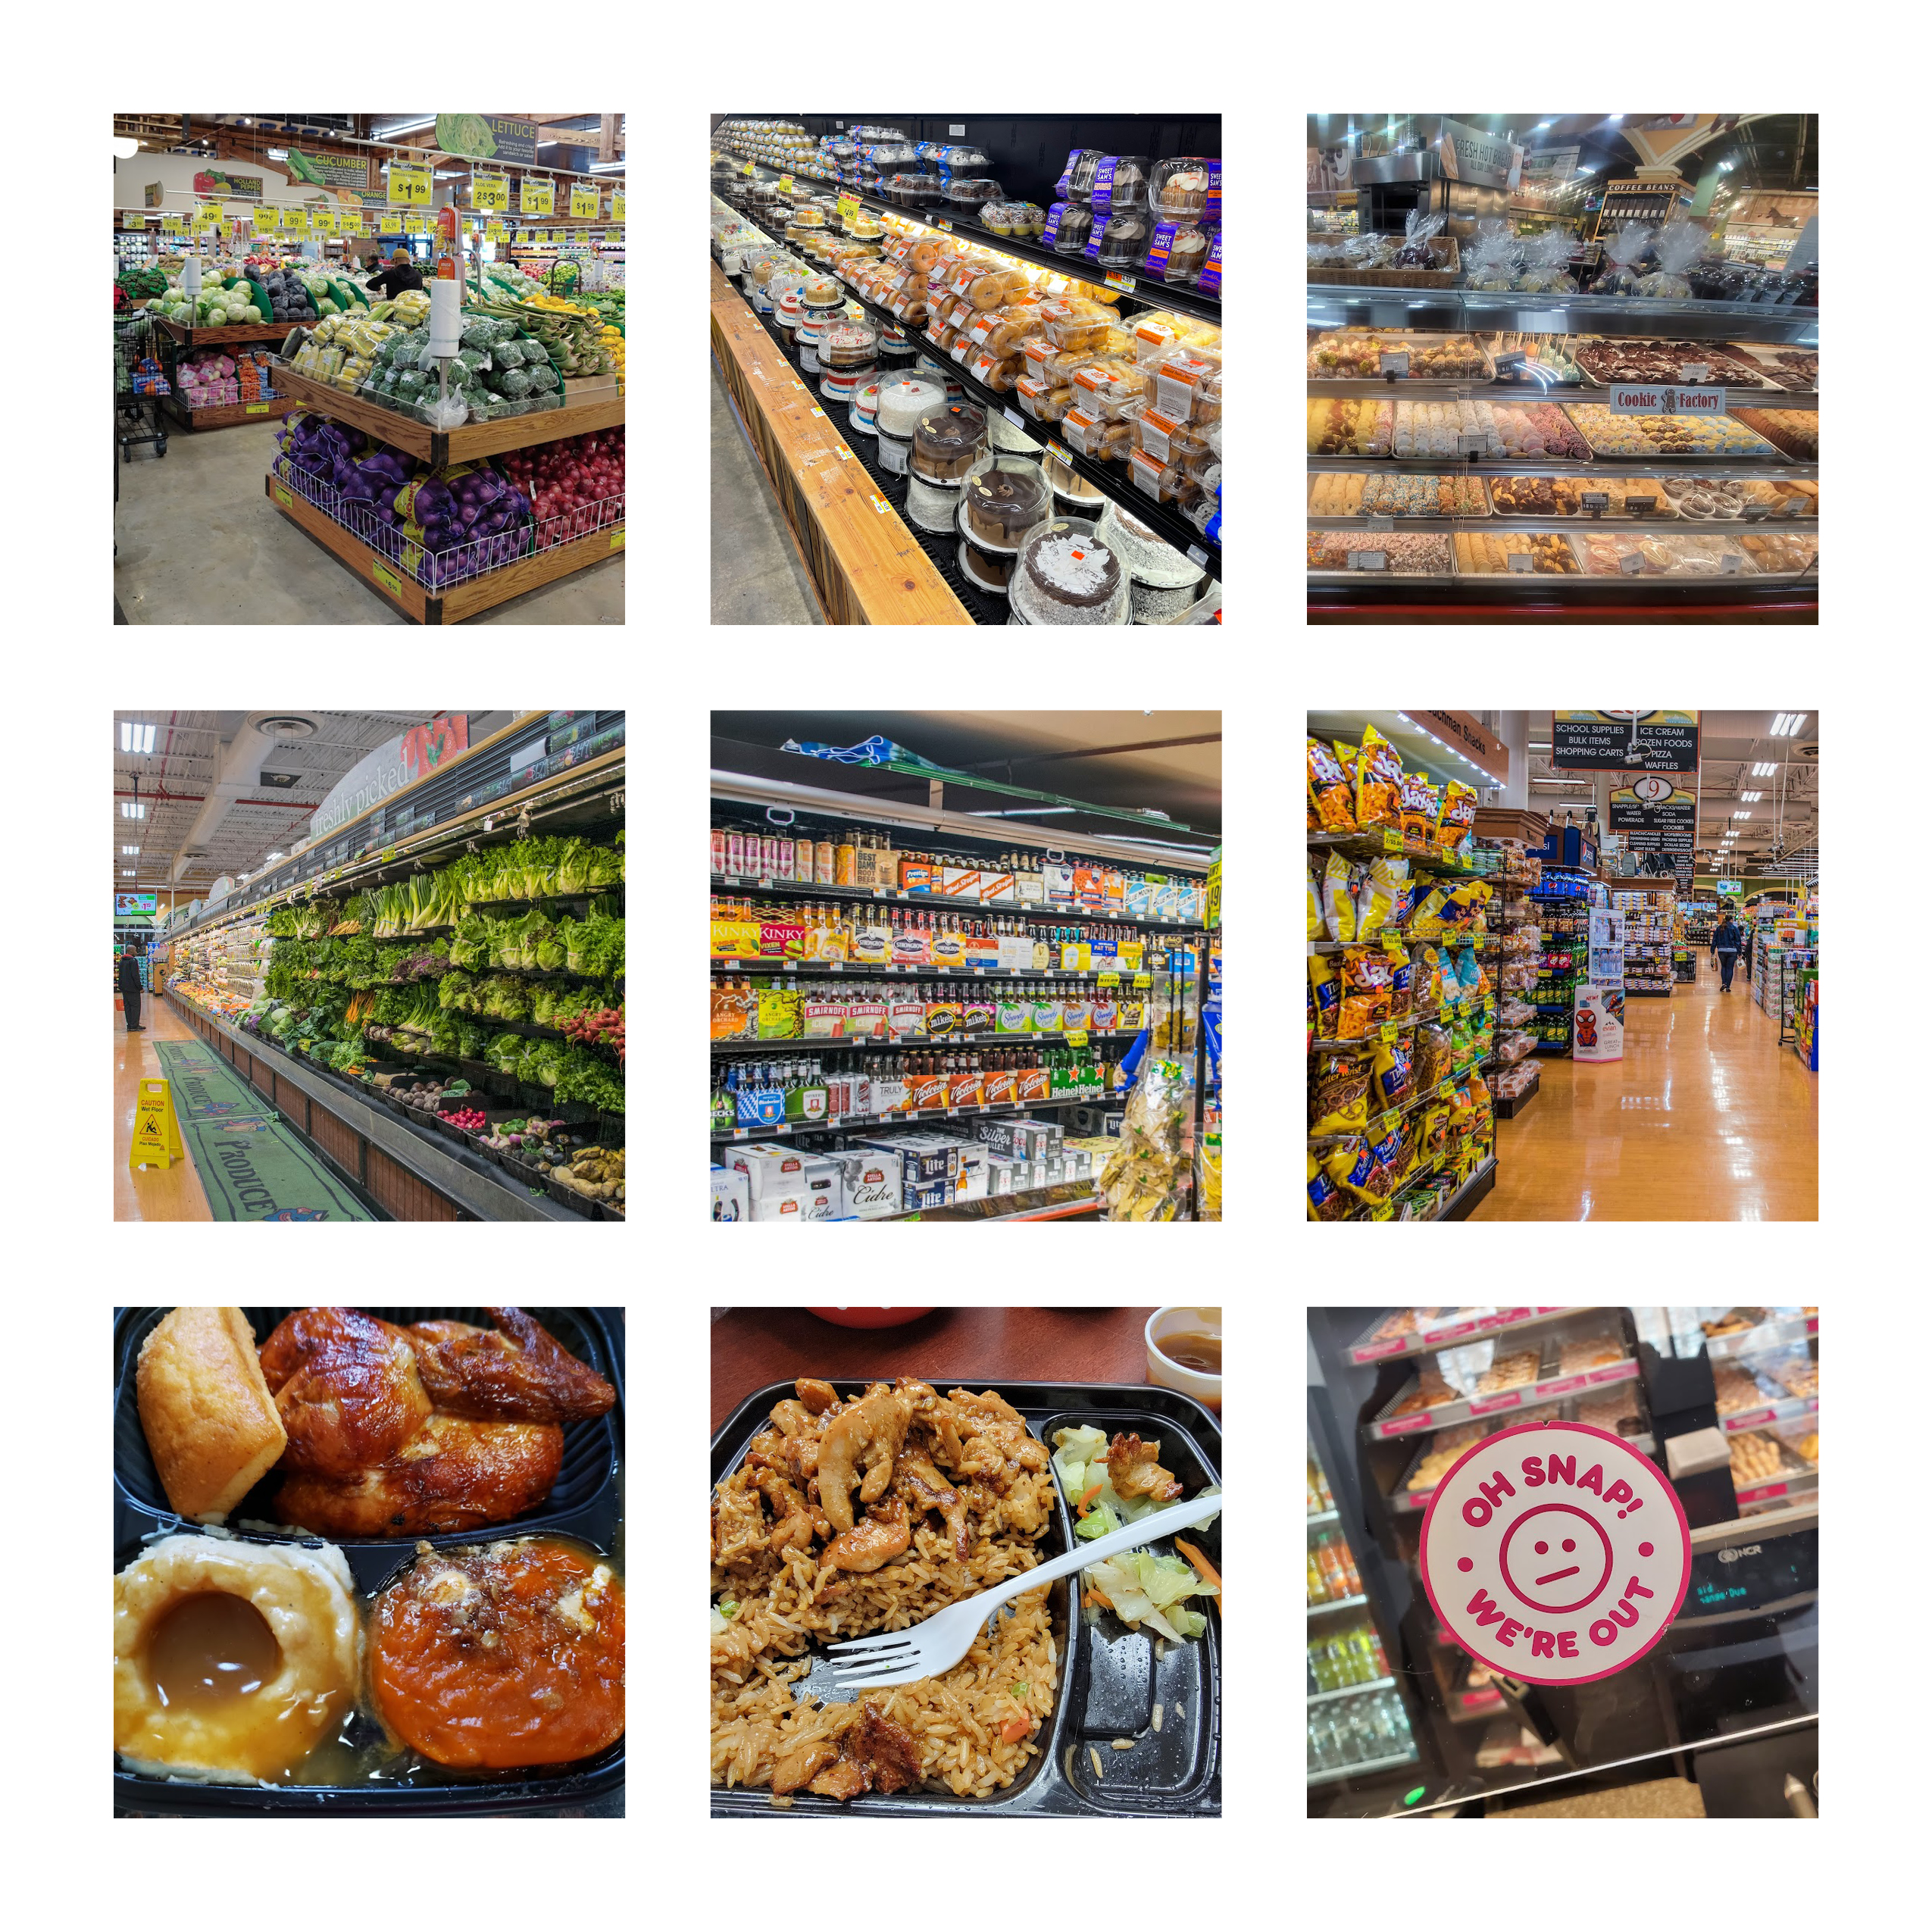
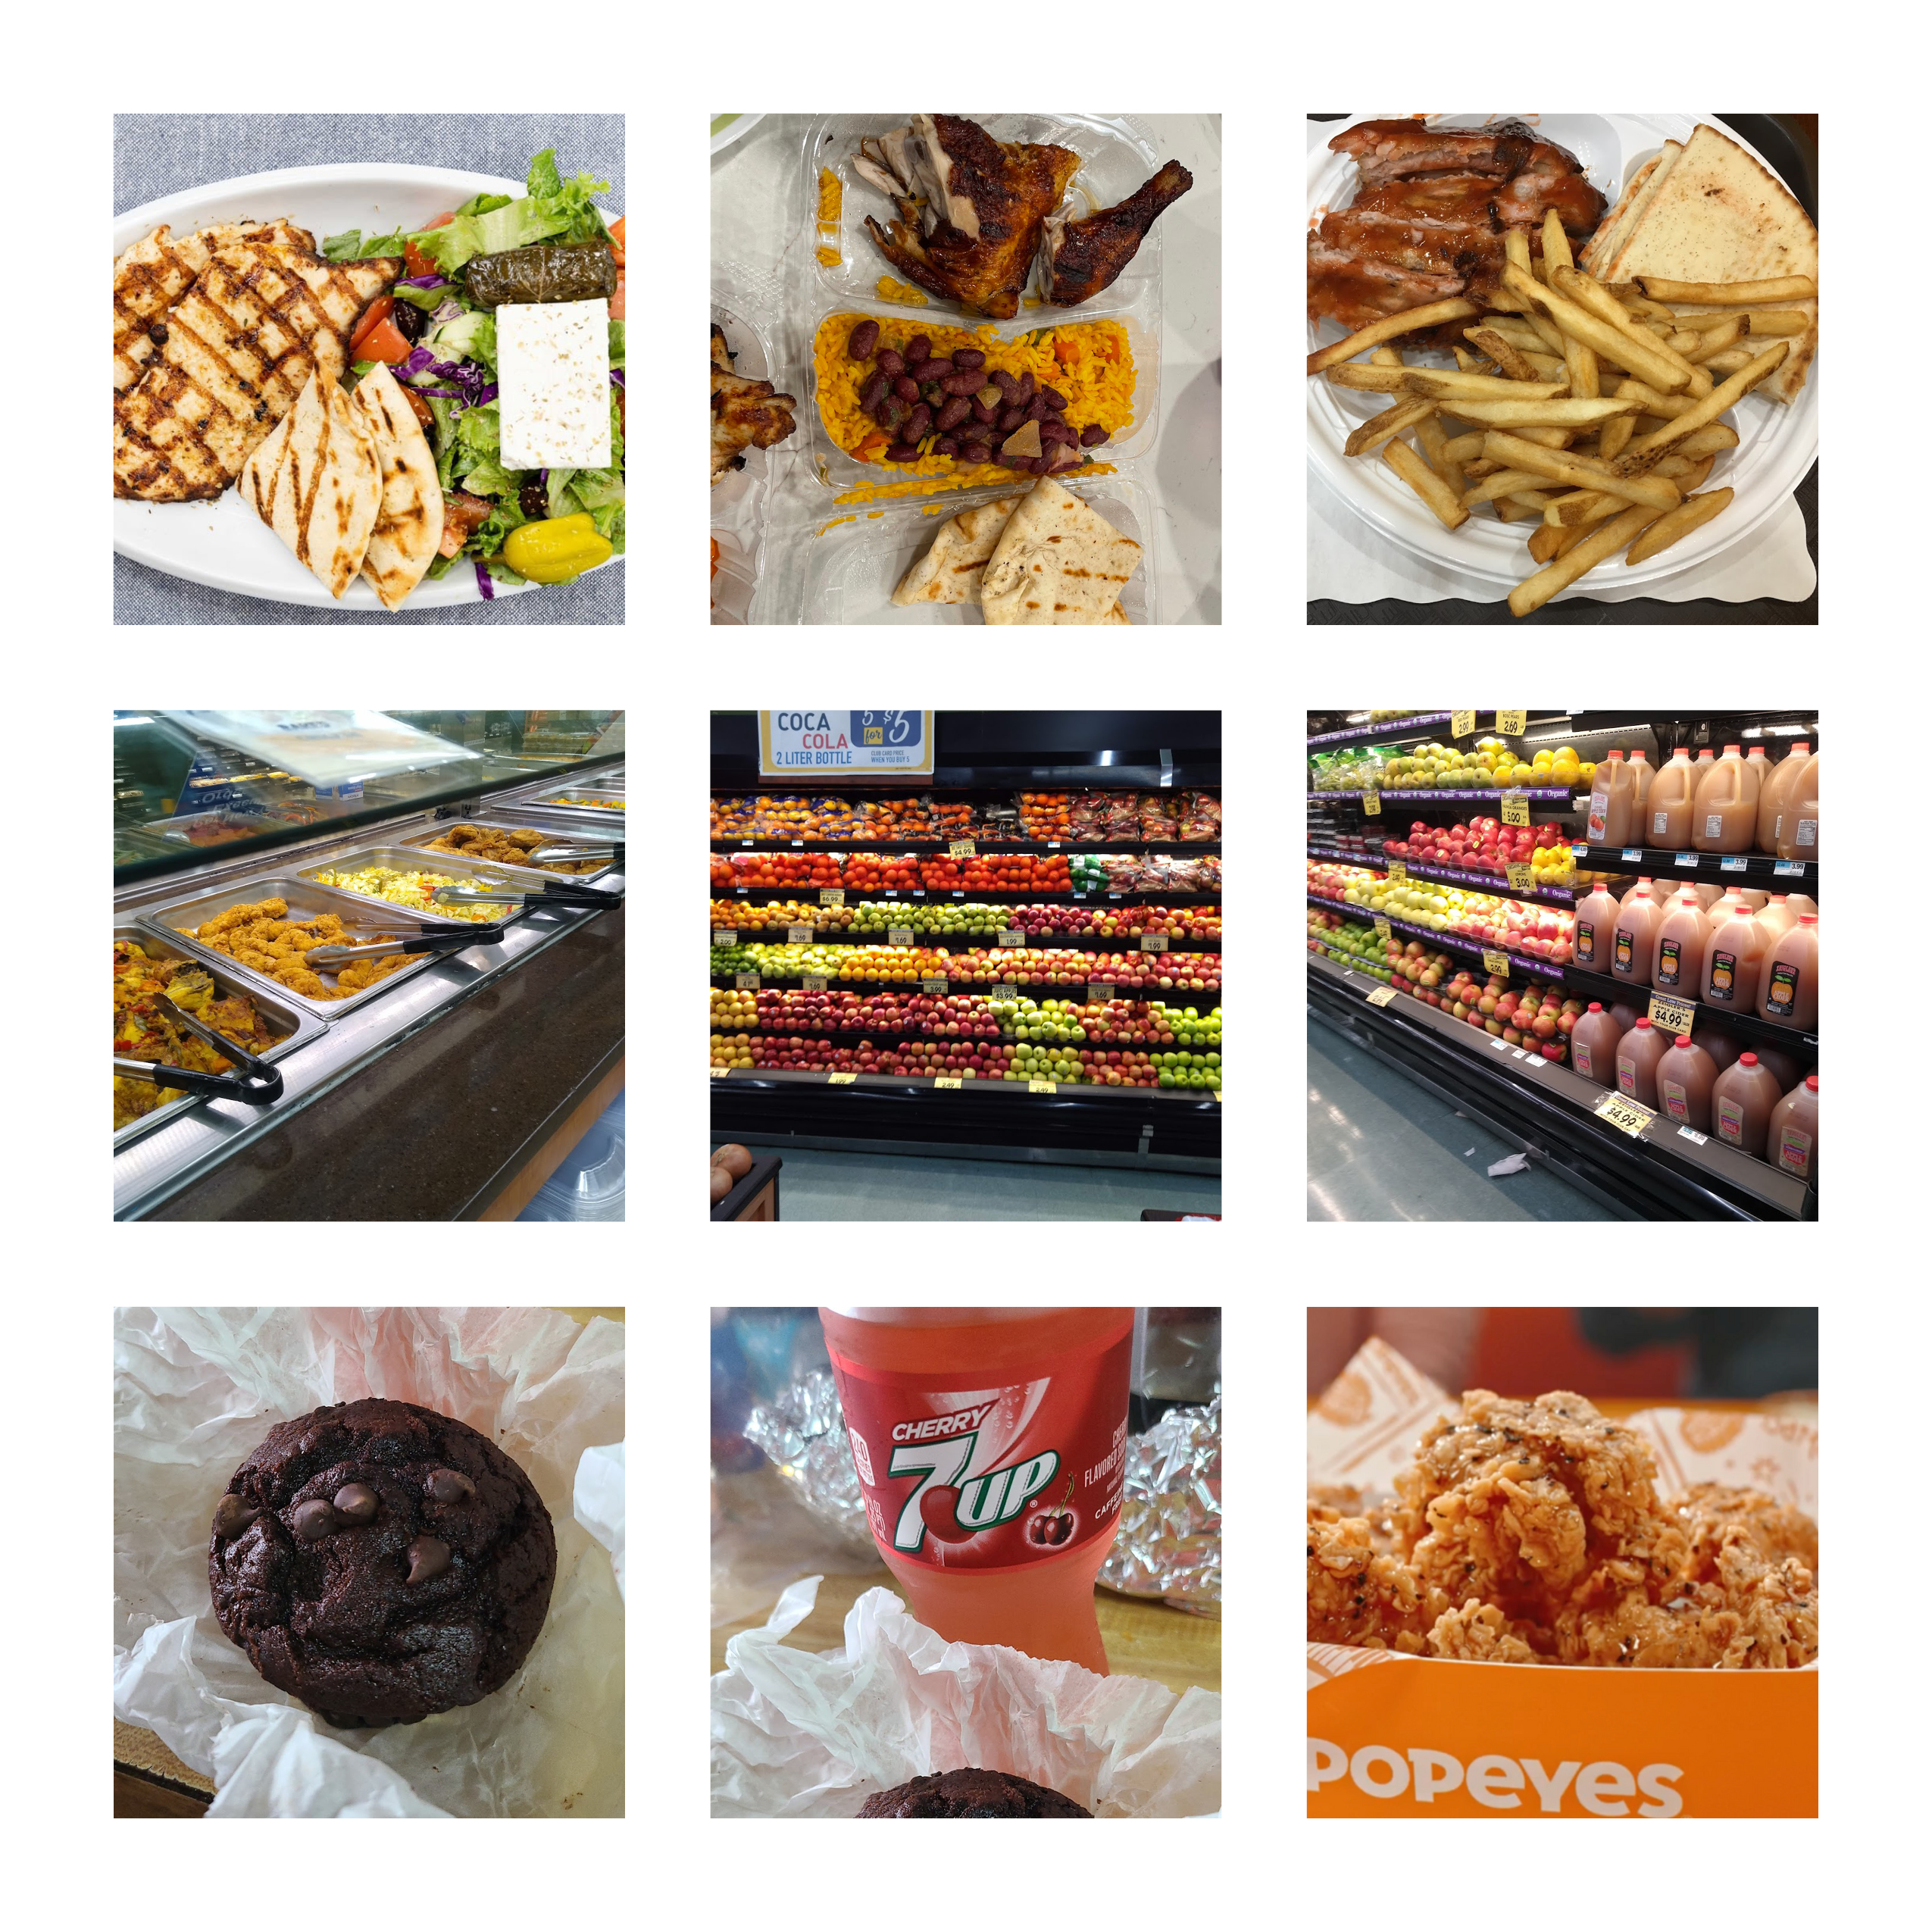
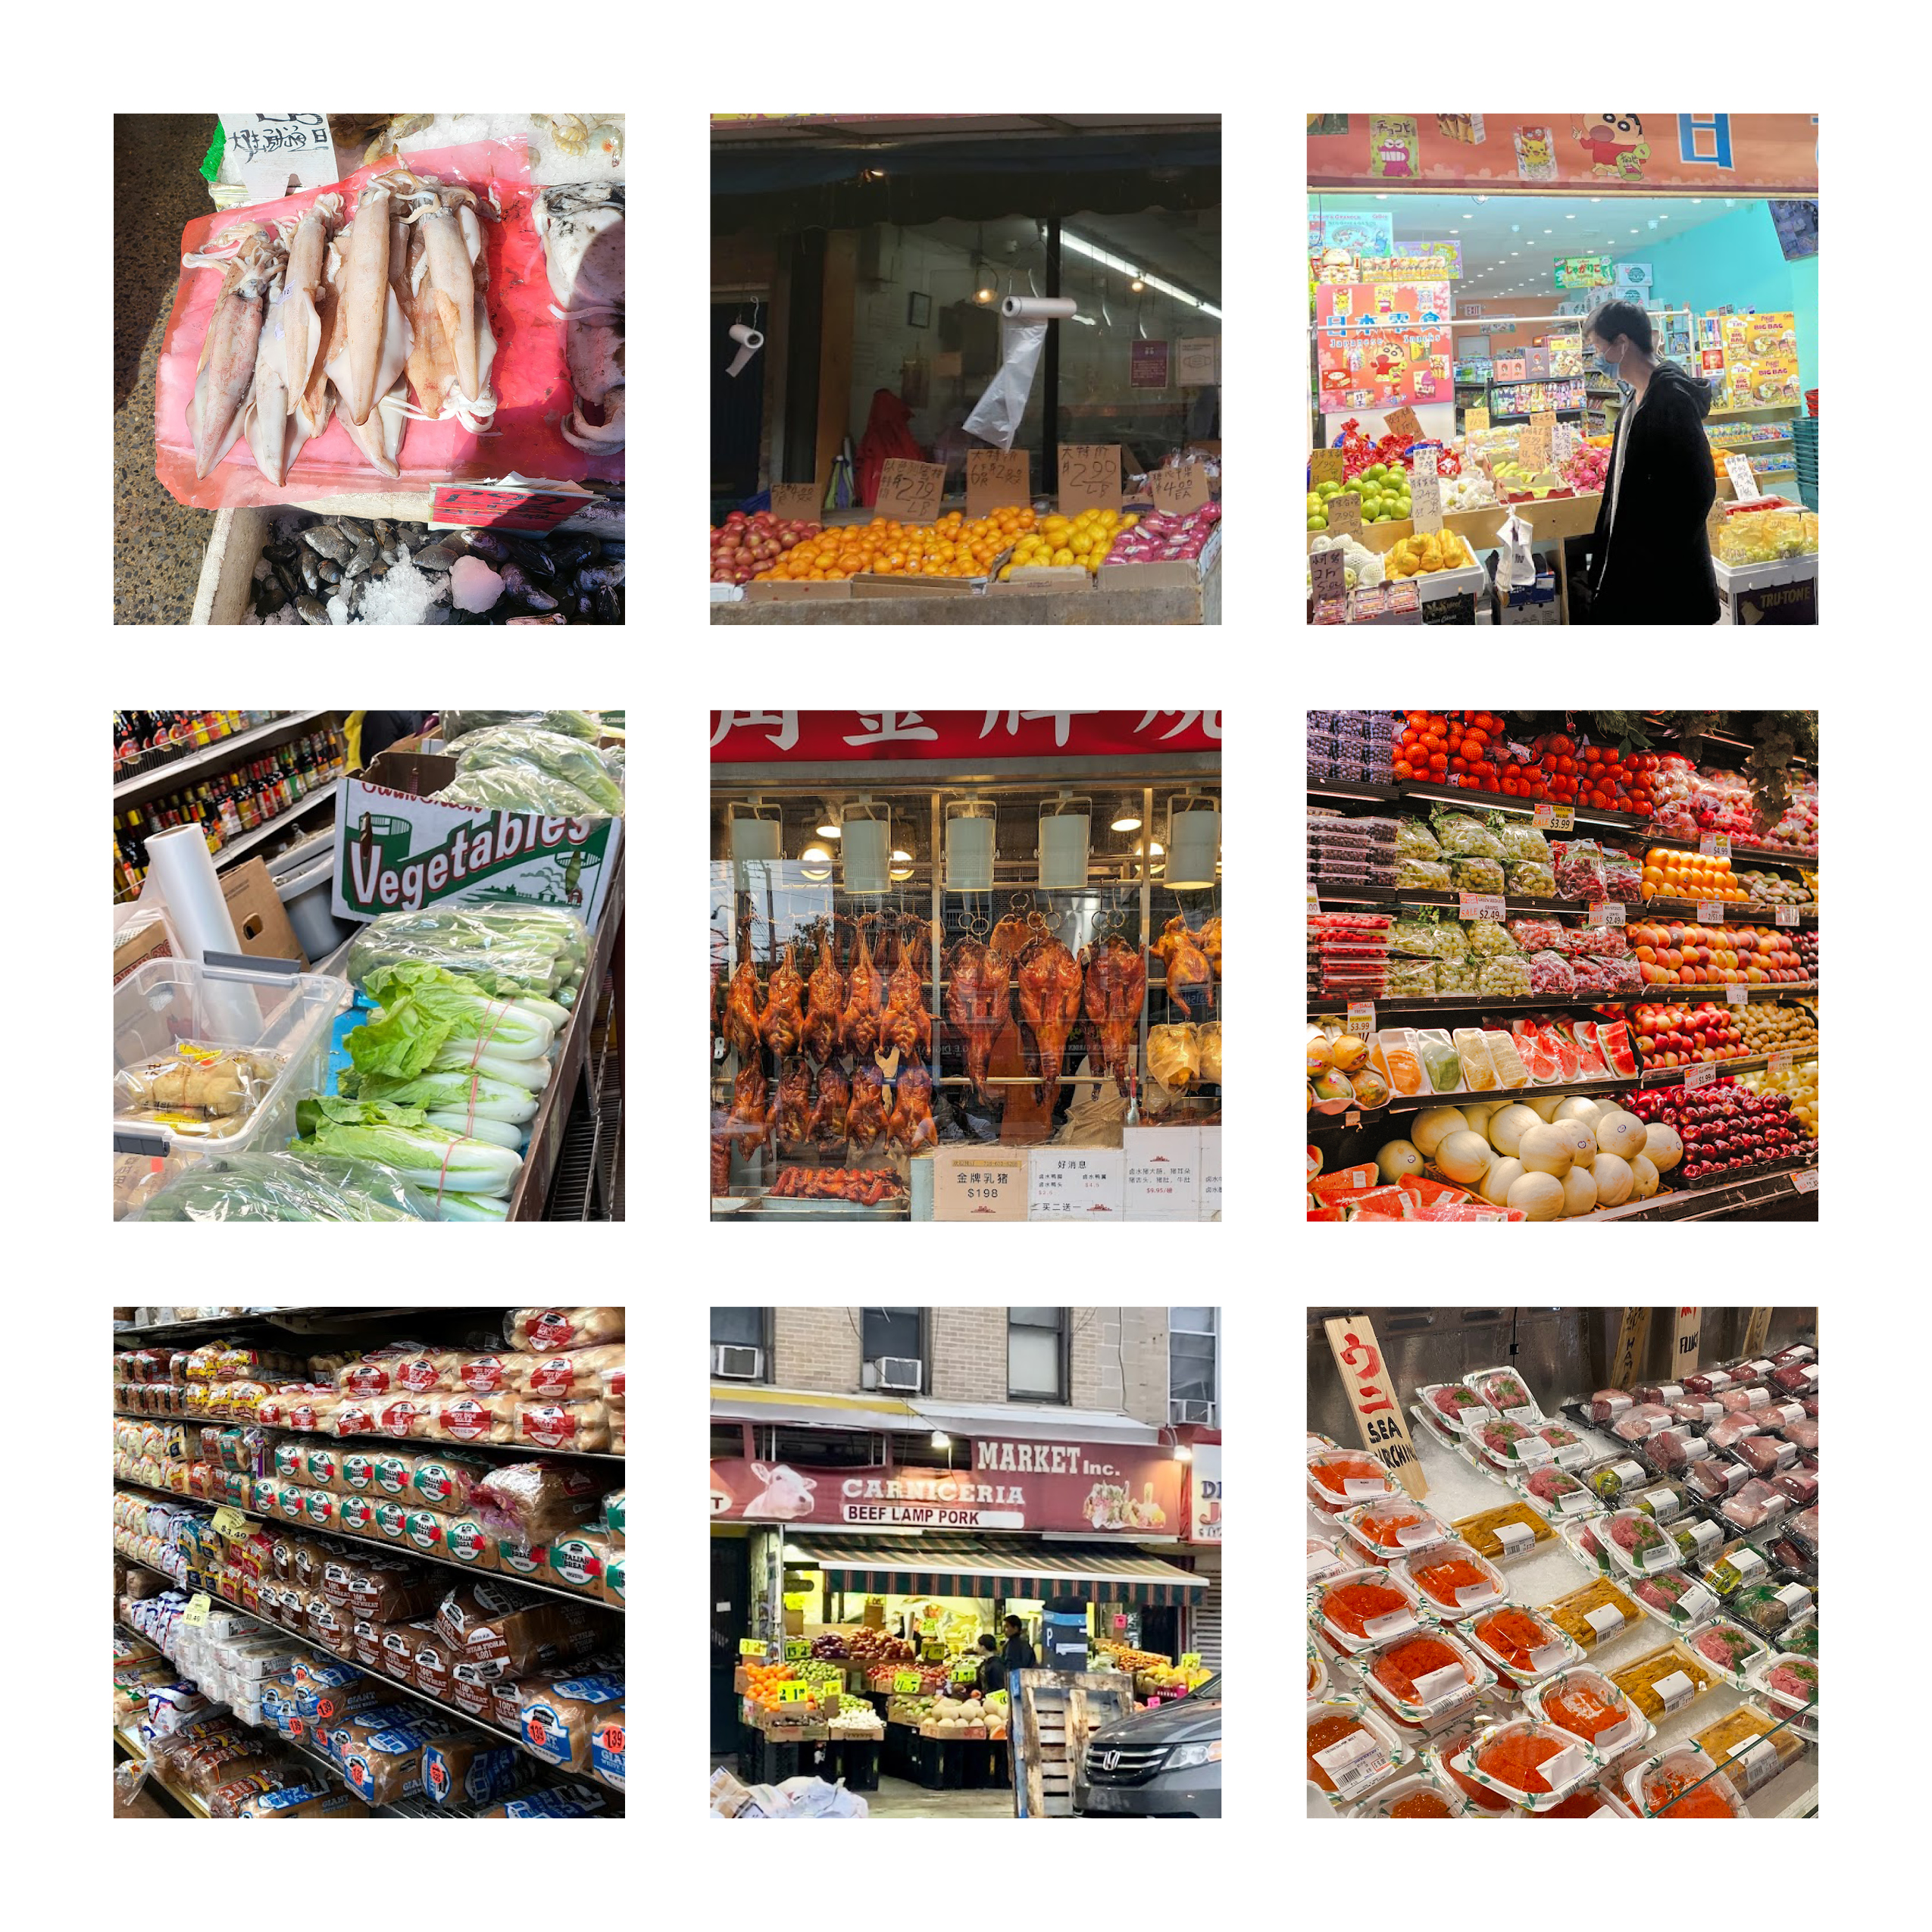
    Matrix of street views showing a food desert (left), swamp (center) and oasis (right).
    Though this will be looked into further, this gives an idea of infrastructural differences
    between the three environments.

    idk

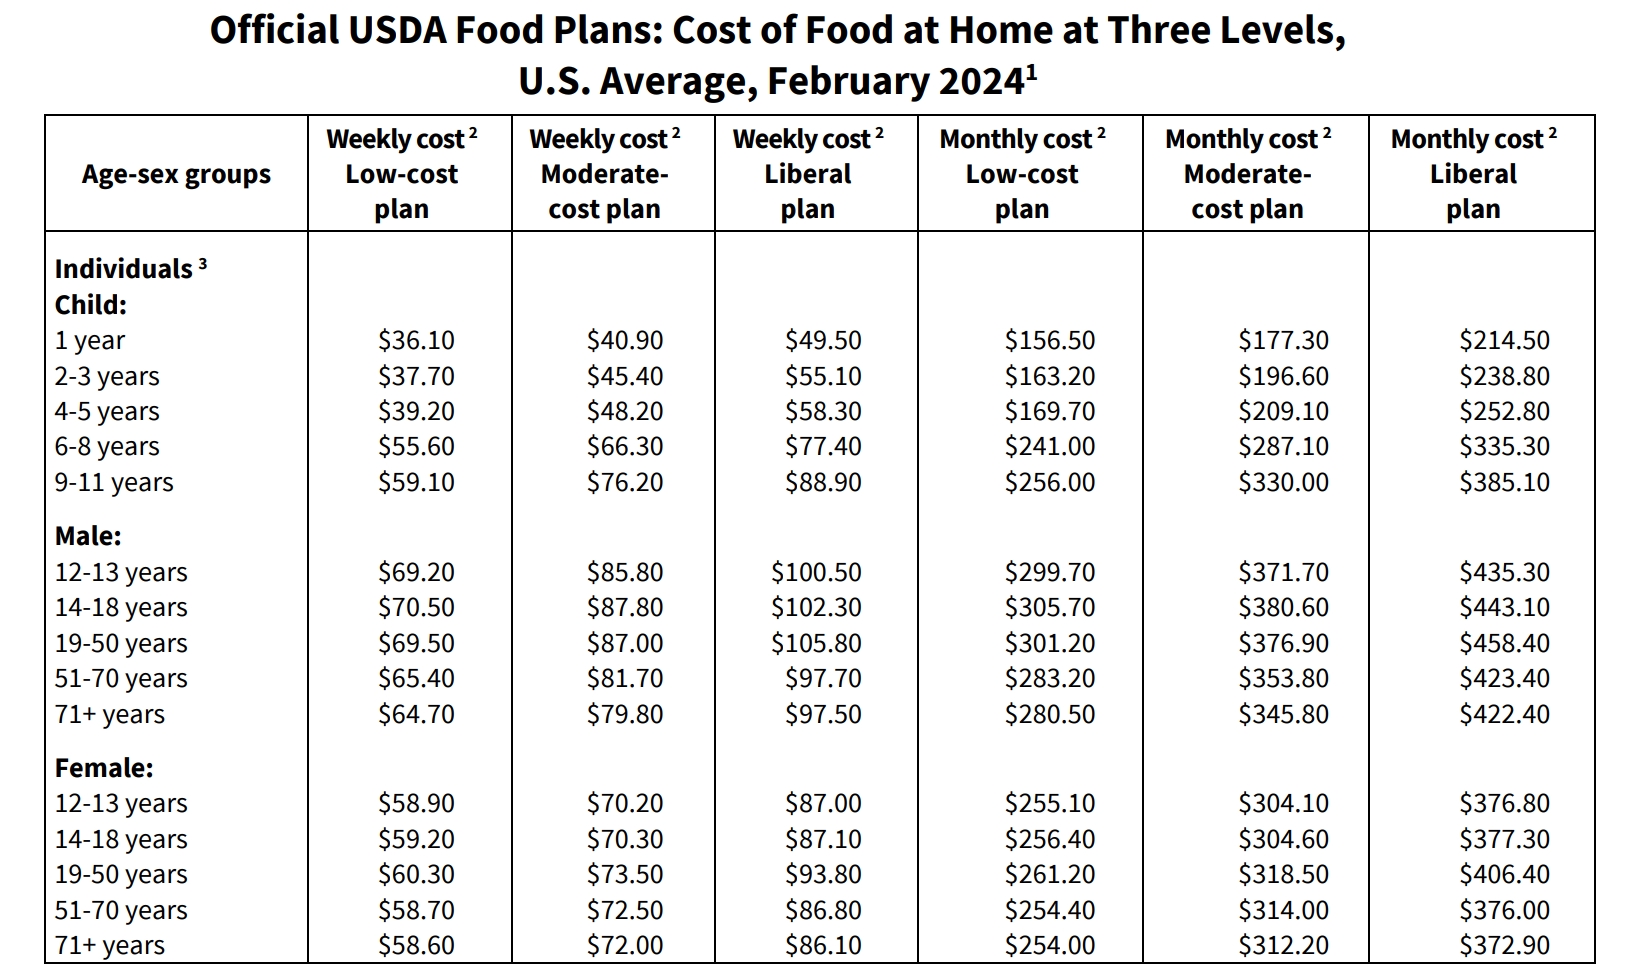
    USDA Table showing recommended costs for healthy, nutritious meals per person.


    hi

    Various types of food vendors. Depending on the food infrastructure, the concentrations of these
    sources will vary throughout each neighborhood.


    02: WHERE IS THE FOOD INSECURITY?

    In order to get a comprehensive understanding
    where food insecurity is most prevalent, it is
    essential to take in data from various sources.
    In these investigations, various infrastructural
    datasets (i.e. supermarket counts, vehicle prevalence)
    are correlated with various economic parameters
    (i.e. Average median income, food stamp prevalence)
    to identify conditions of what makes a place
    food insecure.

    Based on these results, three different neighborhoods
    will be chosen: one food oasis, swamp and desert. These
    areas will be investigated further in a qualitative
    manner, completing the definition of food insecurity
    that the numbers in these quantitative presentations
    cannot articulate.


    02A: DEEPER FINANCIAL BURDENS

    Though the 33,714 USD cutoff for affording
    healthy meals is a good indicator for understanding
    neighborhoods with financial difficulties, it could
    also be justified with another financial parameter--
    rent. According to many major financial institutions,
    such as SoFi and Chase, it is recommended that families
    should invest less than 30% of their income towards
    rent/mortgage in order to be financially sound.


    In this particular graph, there is a comparison
    between the %of income that goes towards food, and
    the %of income that goes towards rent, with the
    dashed red lines representing the recommended
    financial cutoffs. Neighborhoodsthat exceed both of
    these cutoffs are prime candidates that are more
    vulnerable to food insecurity. In this case, these
    neighborhoods get a distinction gives them more
    prioritywhen it comes to classifying which
    neighborhoods suffer from food insecurity the most.


    02B: VEHICLE PREVALENCE

    In certain areas, especially in the outskirts
    of New York City, neighborhoods tend to become
    more sparsely populated, with infrastructure
    being more spread out. In these investigations,
    these can mistakenly read as places that may have
    more difficulty with accessing adequate nutritious
    infrastructure.

    The graph is divided into three groups: one where
    there are lower amounts of supermarkets but
    compensated with higher vehicle ownership (blue),
    one where there are less vehicles but enough
    supermarkets accessible to the public (green),
    and most importantly, one where there are
    inadequate amounts of vehicle ownership and
    supermarket infrastructure. This ultimately
    filters out any false positives regarding any
    neighborhoods that may be seen as food insecure
    due to their sparsely populated food infrastructure.


    02C: FOOD STAMP ASSISTANCE

    Food stamps are typically given to individuals
    that need assistance with obtaining food. In this
    study, food stamp prevalence (Source: US Census
    2020 ACS5) is correlated with supermarket counts
    , and income. This scatterplot also divides into
    three groups, those with good access to supermarkets
    and are able to afford it (i.e. Sunset Park), those
    with decent access to supermarkets but have meager
    means of purchasing goods (i.e. Central Harlem), and
    those who have neither the means of supermarket
    access and/or have higher prevalence of food stamp
    assistance.

    So, where is the food insecurity?

    🟢: Food Oasis
    🟡: Food Swamp
    🔴: Food Desert


    04: WHAT DOES FOOD INSECURITY
    LOOK LIKE?

    Ideally, neighborhoods should have
    infrastructure that allows for
    adequeate access to healthy food
    options. However, in the case of
    places with food insecurity, there
    are holes in the infrastructure
    that give food insecure places
    their classification.

    Within this investigation, a food
    oasis is used as a control group
    and is compared to other food
    insecure neighborhoods in order
    to show the qualitative differences
    and contrasts between infrastructure.

    Using google street imagery, a
    rough panorama is stitched together.
    All these captures are taken every 10
    meters, and all represent the same
    distance.


    SunsetParkPanorama

    Food Oasis: Sunset Park 8th Avenue, 54th-57th Street.
    Total Supermarkets: 22, Total Restaurants: 7, Total Fast Food: 5

    There is an abundant and dense network of grocery vendors, along with a fair share of dining options. Though this is a fairly low income neighborhood, the availability
    of resources and the low dependency on food stamps indicates a neighborhood with sufficient access to healthy options.

    SunsetParkPanorama

    Food Desert: Starrett City. Louisiana Avenue and Twin Pines Drive
    Total Supermarkets: 2, Total Restaurants: 1, Total Fast Food: 8, Total Health: 2

    Starrett City finds itself to only have two total supermarkets located in strip malls, surrounded by various fast-food options. The high prevalence of fast-food establishments
    suggests the neighborhood could populate with more infrastructure that is not just concentrated within the two strip malls in the center of the neighborhood

    CnhPanorama

    Food Swamp: Central Harlem-North. 145th Street, Bradhurst Avenue to Adam C. Powell Boulevard
    Total Supermarkets: 2, Total Restaurants: 1, Total Fast Food: 6, Total Health: 5

    Compared to the Sunset Park example, CH-N has a lower density of food infrastructure. However, fast food & convenience options are more plentiful compared to the supermarkets available.
    However, it is interesting to note the amount of health infrastructure around. Is this due to the higher prevalence of health problems? This implies that though there are options
    available for healthy dining, the combination of the high food stamp prevalence in this neighborhood hints at the preference of more affordable options


    FOOD DESERT: Starrett City


    When it comes to the food infrastructure of Starrett
    City, there are only two supermarkets in the entire
    neighborhood. Outside of these supermarkets, the food
    options mostly involve fast food, dominated by chain
    establishments (i.e. Dunkin, Sarku Japan, etc.) that
    take up Starrett City's retail spaces. With 52% of
    the neighborhood having food stamps, it is also evident
    that healthier options are more difficult to obtain


    Starrett City's infrastructure is mostly apartment
    complexes, with two strip malls. The strip malls also have
    vast amounts of parking space too, which is ironic
    considering the general lack of automobile vehicle usage
    in comparison to other neighborhoods.


    FOOD SWAMP: Central Harlem-North

    CH-N differentiates itself from the food desert
    example by having denser infrastructure-- especially
    with a greater amount of supermarkets overall, unlike
    Starrett City which only has two. However, the
    presence of fast-food options is similar to its food
    desert counterpart is prevalent-- bodegas and fast food
    choices still outnumber supermarket infrastructure.
    With around 45% of their populace also using food stamps,
    it is clear that financial assistance is needed to
    access healthier options.


    CH-N has much more variety when it comes to
    infrastructure, unlike Starrett City which is mainly
    composed of High Rise buildings, strip malls and asphalt
    lots. The density of their infrastructure also makes
    the lack of vehicles not as much of a problem, as this
    offset by plentiful access to the MTA Subway and Bus
    lines.


    Food Oasis: Sunset Park

    Sunset Park differentiates itself from its food
    insecure counterparts by offering a dense supermarket
    network, with almost every block having a food vendor.
    Unlike supermarkets in Starrett City or Central Harlem-
    North, Sunset Park proudly displays their produce
    outside of their premises, and even allot smaller venues
    to have fresh produce, which would've otherwise read as
    fast food restaurants or cornerstores in the food-insecure
    neighborhoods.

    With only 28% of residents using food stamps, and having
    median incomes similar to Central Harlem-North, along with
    similar building typologies, Sunset Park sets a good example
    of how lower-income neighborhoods can still have ample
    access to healthier options at an affordable price. Ultimately,
    Sunset Park minimizes the presence of fast food restaurants,
    in favor of local vendors.


    WHAT IS THE SOLUTION?

    There are various incumbent practices that tackle
    food insecurity throughout the City, such as
    In God's Love We Deliver, which deliver
    groceries to those over the age of 65 and have
    difficulty accessing healtlhy infrastructure.
    There are also other Public food insecurity
    sources, such as the NYC food distribution
    program, wherethose with children attending
    school can have their families benefit by getting
    adequeate meals a day. Other practices can also be
    local to specific neighborhoods, such as church
    food distributions and local cart vendors.

    However, all of these solutions have limitations--
    in order to be sustainable, they must keep their
    audiences small. Practices with too universal of an
    audience would be too expensive, and would either cut
    corners or quickly fizzle out. Each neighborhood is
    also different in terms of their infrastructure,
    populace, and history. In order to create a proper
    solution, it is essential to simulate how these
    incumbent solutions impact their neighborhoods, and
    which ones would work best together and vice versa.


    OPTIONS BRIEF:

    The Senior Citizen Program (option 1) are food drives,
    such as God's Name We Deliver, distribute food to
    individuals that are over age 65 and/or have a disability.
    This strategy is most compatible with communities with
    more seniors or people with disabilities.

    Second, school programs (option 2) work with the city's
    No Kid Hungry Plan to provide meals to students
    and their families based on financial need. This option
    would be most effective in neighborhoods with school
    children and families.

    New supermarket infrastructure (option 3) would create
    new supermarkets in areas that lack them. This would be a
    preferable program in food deserts or in areas that lack
    reliable or accessible transportation to supermarket
    infrastructure.

    Next, religious food drives (option 4) provide meal
    assistance at local places of worship. They are typically
    funded by the city and can adequately feed up to 100
    people. This strategy may be best suited for communities
    of a more religious demographic.

    Lastly, converting vacant storefronts into food banks
    (option 5) is based on PLUTO and can adequately feed up
    to 200 people. This option is desirable in areas that
    may have existing supermarket infrastructure but need
    additional meal assistance resources.


    Case Study I: Food Desert, Ocean Hill

    As a food desert, it is evident that the addition of
    supermarkets in tracts that currently do not have one will
    help at least 20% of Ocean Hill’s population. With the
    abundance of religious infrastructure in Ocean Hill,
    bolstering more funds for these institutions to give out
    meals would help at least 22% of the population. However,
    the options of increased funding for School meals, Senior
    Citizen services and storefront conversion seem to cover
    more individuals, as each option covers >30% of Ocean
    Hill’s population.

    Geographically, each option has more density in other
    regions, which gives speculation to how these programs can
    combine together to optimally serve populations. In the case
    of Ocean Hill, any program that seems to add physical
    infrastructure (i.e. Supermarket additions, filling vacant
    storefronts) would work best in food deserts.


    Case Study II: Central Harlem-North

    Unlike the Ocean Hill case study, where a senior
    citizen program would be more beneficial for the
    community, converting vacant storefronts into food
    banks would be more advantageous for the Central
    Harlem-North (CH-N) community. Strategies like
    increasing the number of supermarkets in the area
    would not be as effective since a relatively accessible
    supermarket infrastructure already exists.

    Although creating food banks from converted vacant
    storefronts is a similar strategy to meal assistance
    from religious organizations, the latter can only
    reliably feed up to 100 people per location. Converted
    vacant spaces would be able to adequately feed up
    to 200 people. Furthermore, the population of CH-N
    is comparatively less religious, so it can be why
    option 3 would be less effective.


    CONCLUSION:

    Food insecurity affects many neighborhoods
    in New York in different ways, whether it’s
    through lack of healthy infrastructure, or
    the inability to afford healthy options.
    Though there are many incumbent programs
    managing the food insecurity issue in the city,
    most of them reach out to a smaller clientele
    in order to maintain the quality of their
    outreach. Trying to create a one-size-fits-all
    solution that could encompass the whole city
    would not only be extremely expensive, but
    would also be unsustainable to properly feed a
    food-insecure population of over 200,000
    individuals.


    Within these neighborhood-scale studies, it
    is essential to note that their respective
    infrastructures and populace are different.
    There can be cases where food insecurity
    takes the form of an area with an abundance of
    fast-food establishments and a lack of supermarket
    access. There can also be cases where food
    insecurity comes from a sparsely populated area
    with a majority senior-citizen demographic that
    have a harder time taking the trip to their local
    vendors. The simulations above show how it is
    important not to look at just one solution, but
    rather to mix and match different solutions
    that tailor the demographics and resources
    these neighborhoods have.


    Ultimately, Biting the Big Apple is
    a stern message to NYC’s government: it has the
    responsibility of allocating these programs
    depending on what makes the most sense for these
    particular neighborhoods. This process is only a
    start, as it uses existing infrastructure– long
    term, the City has to implement permanent foundations
    in order to maintain the healing process these
    introductory interventions offer.